



Why Load Monitoring Matters
Load monitoring is the foundation of safe and financially controlled electricity use. It helps detect conditions that lead to contract violations, equipment damage, fire risk, energy waste, excessive peak-hour charges, and failures to meet demand response obligations — making it a critical control mechanism for both electricity consumers and grid operators.
Load monitoring addresses seven categories of practical problems:
- Contracted capacity violations. Every grid-connected consumer operates under a grid connection agreement that defines a maximum demand limit (MDL). Exceeding this limit can trigger financial penalties or force a contract renegotiation. In jurisdictions with capacity-based tariff components — primarily the USA, Europe, Southeast Asia, and Latin America — the MDL can determine a significant share of the monthly electricity bill.
- Equipment failure on overloaded network segments. A distribution transformer running continuously beyond its rated capacity ages approximately four times faster than one operating within its rated limits. Continuous per-phase load monitoring provides the early warning needed to redistribute load before thermal stress becomes irreversible.
- Fire risk from overloaded conductors and switchgear. Sustained overcurrent causes resistive heating that degrades wire insulation, weakens contact connections, and creates arc fault conditions — often inside wall cavities, cable trays, or distribution panels, invisible until a fire has already started. Monitoring per-phase currents and apparent power provides systematic detection of dangerous loading conditions.
- Energy waste during non-operating hours. Equipment left energized after shifts, nights, weekends, or public holidays generates costs without output. Load profile analysis makes this waste immediately visible: abnormally high demand outside operating hours stands out clearly on the chart.
- Unauthorized use of commercial equipment. Load monitoring can detect off-the-books use of commercial equipment by staff more reliably than cameras. Each operational cycle leaves a timestamped energy signature in the power profile. Cross-referencing the profile against the booking or POS order log surfaces discrepancies automatically. Unlike video footage, energy data is faster to analyze, carries no privacy implications, and is better protected from deletion by staff.
- Demand charges and peak-hour tariff exposure. In many tariff structures, the demand charge for the entire billing month is set by the single highest demand interval recorded. One coincident peak — a simultaneous startup of several loads — can drive a significant increase in the monthly bill. Load monitoring enables proactive demand management: shifting flexible loads to off-peak hours, temporarily shedding non-critical equipment, and optimizing operating schedules.
- Demand response compliance. Consumers enrolled in demand response programs must reduce demand below a specified threshold on command from the system operator or aggregator. Meeting this obligation requires real-time visibility into aggregate facility demand — exactly what one-minute power profile or instantaneous value polling provides.
Two Load Control Methods, One Goal
AMI systems offer two fundamentally different approaches to load monitoring, each with distinct data characteristics, strengths, and limitations:
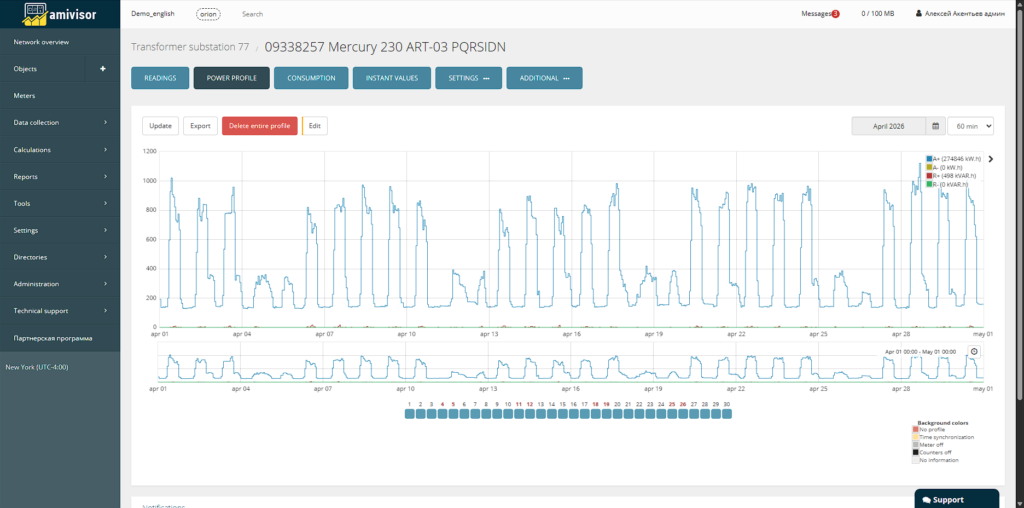
- Power Profile Monitoring — based on averaged demand values recorded over fixed integration intervals (typically 15, 30, or 60 minutes) and stored in the meter’s internal memory.
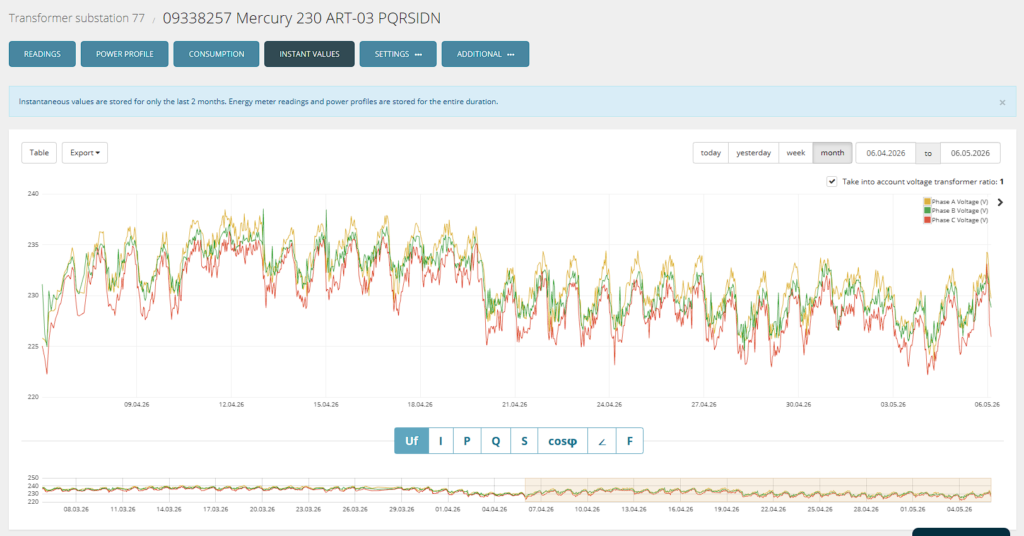
- Instantaneous Value Monitoring — based on real-time electrical parameters (voltage, current, active and reactive power, power factor, frequency) polled directly from the meter at configurable intervals.
The two methods are not interchangeable and do not compete. Each excels in a different subset of the seven problem categories above. Understanding the difference is essential for designing a monitoring strategy that fits your requirements in terms of regulatory compliance, operational reliability, and safety.
Method 1: Load Control via Power Profile in Amivisor
How It Works
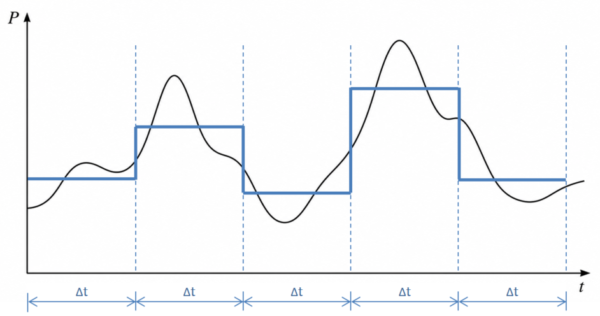
A smart meter continuously measures energy consumption and accumulates it over a fixed integration interval — typically 15, 30, or 60 minutes. At the end of each interval, the meter calculates the average active power for that period and stores it as a single record. This sequence of averaged values is called the load profile (or demand profile).
The Amivisor platform polls these records on a schedule and renders them as a step chart, where each step represents one interval. Because the steps are contiguous and cover the entire timeline without gaps, the load profile provides a complete historical record of how demand evolved over time.
Key technical characteristics:
- Data stored in meter memory — typically up to 180 days, depending on the meter model and the configured integration interval.
- No data loss on communication failure — records accumulate in the meter and are retrieved when connectivity is restored.
- Shorter integration intervals reduce the total retention period in the meter and increase the communication load.
- The load profile typically records total three-phase aggregate active and reactive power — without per-phase detail.
- Profile data is retained in the cloud platform for up to 5 years — sufficient for seasonal analysis, load forecasting, and tariff plan optimization. In on-premise deployments, the retention period is configured by the system administrator.
Where Power Profile Excels
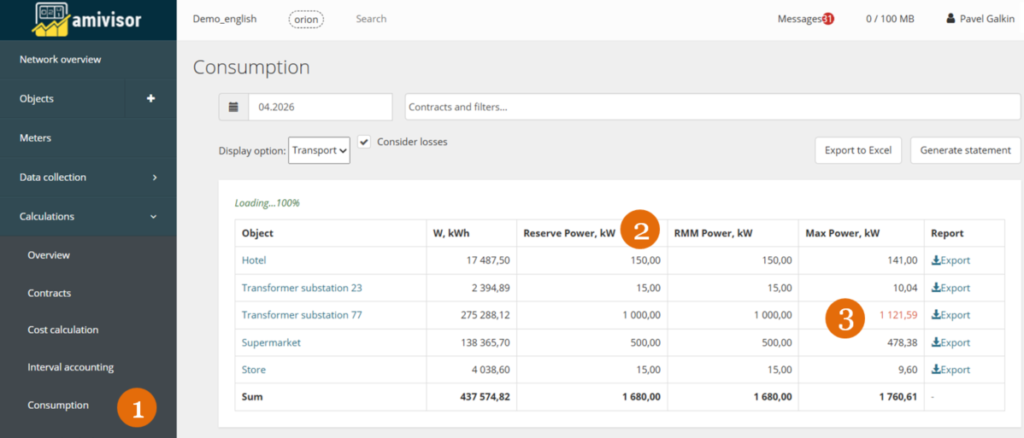
Contracted capacity control and billing compliance. Power profile data is the primary instrument for verifying compliance with MDL limits. Regulators and DSOs in most jurisdictions use averaged maximum demand — not instantaneous peaks — as the basis for capacity charges. When used by energy supply organizations, Amivisor automatically compares the maximum profile value in a billing period against the MDL and flags violations.
Aggregated load monitoring across multiple meters. When a facility has several metering points, the power profile is the only method that enables accurate load aggregation. Because each meter records demand values for the same fixed time intervals — enforced by meter clock synchronization — profile records from different meters always refer to identical time windows and can be summed directly.
Reliable data under poor connectivity. On remote sites or where communication is intermittent, power profile is the only method that guarantees data integrity: all records are stored locally in the meter and retrieved upon reconnection.
Detection of after-hours waste and unauthorized equipment use. The continuous, gap-free load record is the most reliable tool for identifying consumption outside operating hours — whether from equipment left on accidentally or from unauthorized use of commercial facilities.
Limitations of Power Profile
- Short-duration spikes are smoothed out. A power surge shorter than the integration interval raises the averaged value for that interval but does not appear at full magnitude. Switching to 1-minute intervals reduces this problem, but not all meters support it.
- No per-phase detail. The standard load profile records aggregate three-phase power. Diagnosing phase imbalance from profile data alone is generally not possible.
- Inherent data latency. The demand value for a given interval is only available after it closes — the most recent profile reading is always one full interval old.
Method 2: Instantaneous Value Monitoring in Amivisor
How It Works
Unlike the load profile, instantaneous values (IV) are not stored inside the meter. They represent the electrical state of the circuit at the exact moment of the query. When the platform polls the meter, it reads a live snapshot of electrical parameters. Whatever happens between polls is not recorded anywhere.
Parameters available via instantaneous values (standard parameter set):
- Voltage per phase (V)
- Current per phase (A)
- Active power per phase and total (kW)
- Reactive power per phase and total (kVAR)
- Apparent power per phase and total (kVA)
- Power factor per phase and total
- Grid frequency (Hz)
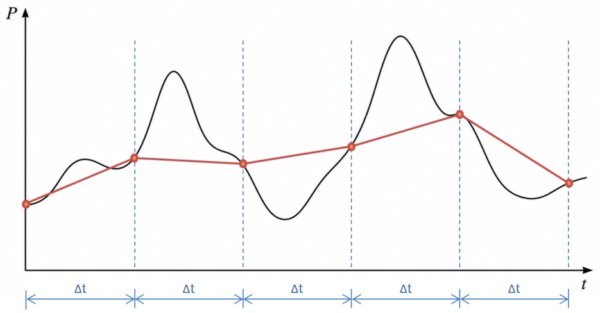
The polling interval is configured in the monitoring system. Typical deployments use one-minute or one-hour cycles. The platform renders data as a time series, but the connecting lines between data points are a visualization convention only: each value is a discrete sample, and what happens between samples is unknown to the system.
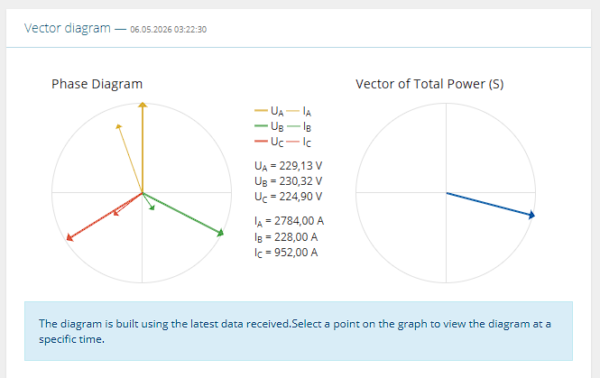
In addition to scalar parameters, the platform can generate a phasor (vector) diagram from instantaneous voltage and current readings, enabling verification of phase connections and reactive power analysis.
Where Instantaneous Values Excel
Real-time alerting and threshold notifications. Because instantaneous values can be polled every minute, the platform evaluates each incoming reading against configurable thresholds and dispatches notifications with near-zero delay — a capability that the load profile, with its inherent interval delay, cannot provide.
Per-phase power analysis. Instantaneous values expose per-phase active, reactive, and apparent power, enabling diagnosis of asymmetric loading. Continuous IV monitoring detects phase imbalance before it causes transformer overheating or neutral conductor damage.
Comprehensive parameter visibility. IV polling simultaneously captures multiple electrical quantities — voltage, current, power factor, frequency — supporting full diagnostic analysis. The phasor diagram provides an integrated tool for detecting incorrect phase rotation, reversed CT connections, and reactive power deviations.
Limitations of Instantaneous Values
- No data retention in the meter. Communication outages create permanent gaps — IV data lost during downtime cannot be recovered retroactively.
- Not suitable for multi-meter load aggregation. IV are polled sequentially, not simultaneously. Even with short polling cycles, the readings from different meters within a group are captured at slightly different moments in time. This time offset makes it impossible to construct a reliable aggregate demand value for a metering group — each reading reflects a different instant of the system’s state.
- Short retention in the cloud platform. In the SaaS version, IV data is retained for 2 months; in on-premise deployments, retention is user-configurable. IV data cannot substitute for the load profile for long-term demand analysis.
- Higher platform load. One-minute polling generates significantly more communication traffic and server load, reflected in higher platform subscription tiers.
- Interpretation complexity. Without clearly configured alert rules and thresholds, important anomalies may be missed within the volume of data collected across multiple parameters.
Real-World Applications
Power Profile: Case Studies.
Case Study 1: Distribution System Operator — Contracted Capacity Enforcement
A regional DSO was systematically failing to detect consumers whose demand regularly exceeded their contracted capacity. Manual verification was too slow, and consumers were repeatedly violating their grid connection agreements without facing penalties.
After deploying power profile monitoring across the metering infrastructure, the system began automatically flagging every interval in which a consumer’s demand exceeded the MDL. The DSO was able to proactively notify violating consumers, enforce contract upgrades, and increase revenue from capacity subscription agreements — without adding headcount.
Case Study 2: Restaurant Chain (Temple) — After-Hours Fire Risk and Energy Waste
Kitchen staff at a restaurant chain were routinely leaving stoves and ovens energized after closing. The problem went undetected because management had no visibility into consumption between closing and the next morning’s opening.
The consequences were twofold: electricity bills were elevated by unnecessary overnight consumption, and heated equipment left unattended in empty premises represented a genuine fire risk.
Amivisor was configured to send an alert to the site manager whenever consumption exceeded 1 kW during non-operating hours (23:00–12:00 daily). Each alert required the administrator to immediately return to the premises to verify and shut down the equipment.
The problem was resolved without significant capital investment — notification-based monitoring alone was sufficient to eliminate the “forgotten equipment” pattern.
Case Study 3: Service Businesses — Detecting Unauthorized Equipment Use
Several service-sector clients faced revenue losses from staff conducting off-the-books transactions using the company’s commercial equipment — a car wash, a sauna, and a dental practice among them. In each case, services were rendered without registration in the booking system, with payments collected privately by staff.
Video surveillance had been tried but proved insufficient: staff quickly learned that footage was not monitored in real time, and in some settings — changing rooms, treatment rooms — camera installation was not legally or ethically permissible.
Load profile monitoring provided a different kind of evidence. Each equipment cycle left a distinct, timestamped energy signature in the profile. Cross-referencing these events against the official order log from the booking or POS system surfaced discrepancies automatically: a consumption cycle with no corresponding registered transaction became a measurable, documented indicator of unauthorized activity.
Unlike video footage, energy data is faster to analyze, carries no privacy implications for clients, and is better protected from deletion by staff — making it a more reliable audit layer than physical surveillance.
Case Study 4: Municipal Water Utility (Klin Vodokanal) — Reducing Peak Demand Charges
A municipal water utility operates several pumping stations supplying clean water reservoirs for the city of Klin. Load profile analysis revealed that consumption peaks systematically coincided with peak tariff hours, resulting in elevated electricity bills.
The utility restructured pump scheduling: reservoirs are now filled during low-tariff hours, and pumping is suspended during peak windows — water supply is maintained by drawing down stored reserves. The platform provides continuous load monitoring to ensure the new schedule is maintained.
The result was a reduction in electricity costs of up to 59%, achieved without any significant infrastructure investment — only operational scheduling changes guided by platform data.
Instantaneous Values: Case Studies.
Case Study 5: Industrial Consumer (Antares) — Demand Response Compliance
A large industrial consumer entered a demand response agreement, committing to reduce facility demand below a specified threshold upon receiving a dispatch signal from the system operator. The facility dispatcher configured one-minute IV polling and activated threshold alerts for demand reduction commands. Operations team received immediate notifications when aggregate demand approached the ceiling, enabling them to shed non-critical loads within the required response window. The company meets all dispatch instructions and receives demand response incentive payments.
Case Study 6: Office Building — Identifying the Cause of Breaker Trips
An office building was experiencing repeated breaker trips during the lunch period. One-minute profile data showed a recurring load increase up to 40 kW between 13:00 and 15:00 — against a continuous permissible load of 30 kW — while per-phase instantaneous values revealed load imbalance across phases.
The data correlated the overloads with simultaneous use of microwaves, kettles, water dispensers, and printers processing large jobs queued before the lunch break. With time-stamped charts from the platform, the facility engineer proved to management that the issue was caused by the load pattern, not by outdated wiring.
After lunch breaks were staggered, equipment use was regulated, and load was redistributed across phases, peak demand dropped to a stable 20–25 kW range and breaker trips stopped.
Monitoring Total Load Across Multiple Meters
Many facilities — industrial plants, office and retail centers — have more than one metering point on the same grid connection. The Amivisor platform supports this configuration.
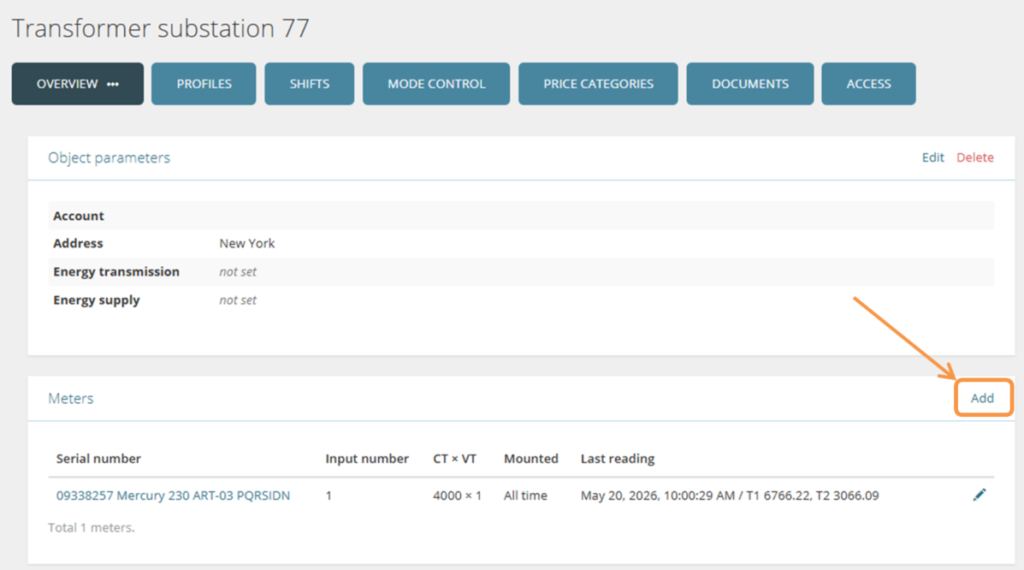
In such cases, interval consumption values across all meters are summed, and the system continuously tracks the combined demand against the site’s overall MDL:
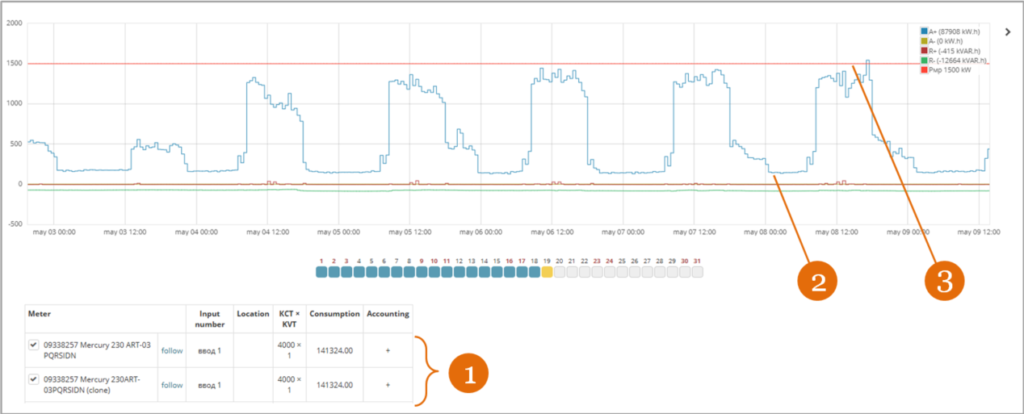
The power profile is the preferred method for technically valid multi-meter aggregation. Meter clock synchronization ensures that all devices in a metering group record their averaged demand values for exactly the same time intervals — regardless of when the platform retrieves those records. Instantaneous values cannot provide this guarantee: polling multiple meters in sequence introduces time offsets between readings, making it impossible to sum them into a meaningful aggregate demand value at a single point in time.
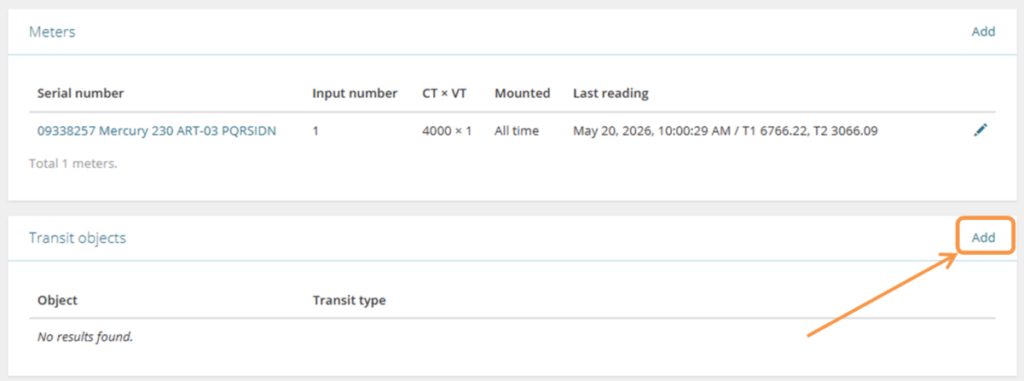
Transit metering. For DSOs and facility operators with sub-tenants, the MDL applies only to the operator’s own load — not to the pass-through consumption of sub-tenants. The platform handles this through transit metering point configuration: sub-tenant meters are designated as transit points, and their consumption is automatically subtracted from the aggregate profile.
Power Profile vs. Instantaneous Values: Choosing the Right Approach
The two methods are complementary. The right configuration depends on the primary objective:
- Contracted capacity control and billing settlements — the primary instrument should be the power profile.
- Peak demand management and tariff optimization — the power profile is the primary instrument; when implementing measures to reduce peak-hour consumption, combining it with instantaneous value threshold alerts is advisable.
- After-hours load control and unauthorized equipment use detection — both methods work best together: the power profile provides a continuous, gap-free archive and feeds the Shift Accounting and Operating Modes modules, while instantaneous values enable near-real-time notifications.
- Phase imbalance diagnosis and fault prevention — instantaneous values are required, as only they provide per-phase data and apparent power measurements with threshold alerting.
- Demand response compliance — both methods are needed, with one-minute instantaneous value polling on all metering points.
- Remote sites and locations with unreliable connectivity — the power profile is the preferred method, as instantaneous values are permanently lost during communication outages.
By facility type, recommended starting configurations are:
- Industrial consumer on interval tariff — Power Profile at the interval required by the supplier (15, 30, or 60 min) combined with IV threshold alerts for active demand management.
- Demand response participant — Power Profile at 1–15 minute intervals and IV at 1-minute polling on all metering points.
- DSO / network operator with sub-tenants — Power Profile at 30–60 minute intervals for MDL monitoring and hourly balances, plus 1-minute IV polling on controlled substations for fault risk reduction; transit metering configured for all sub-tenant points.
- Office or retail building with tenants — Power Profile per tenant for hourly balance; IV monitoring on HVAC and core building equipment.
- Metering point with multiple inputs — The power profile is the primary instrument whenever aggregate demand across a metering group at the facility level must be monitored.
- New installation or commissioning — IV with phasor diagram for connection verification before go-live.
Effective load control is not a choice between two methods — it is a question of finding the combination that best meets your requirements. The power profile provides a continuous, legally traceable archive of consumption. Instantaneous values provide the real-time situational awareness needed to prevent violations before they occur. Together, the two methods cover the full spectrum of load monitoring objectives.
If the challenges described in this article resonate with your infrastructure, Amivisor may be worth a closer look. The platform is purpose-built for AMI environments — combining real-time load monitoring, anomaly detection, and granular analytics in a single operational layer that integrates with existing metering systems without a full stack replacement. Our team works directly with utilities, grid operators, and energy managers to configure monitoring logic that fits your specific topology and load profiles. Whether you are evaluating methodologies or ready to benchmark against your current toolset, we are happy to walk you through what a deployment looks like in practice.